Why use it
Use Tooltip Analytics to monitor how well your Tooltips are driving software adoption and supporting your users where they need help. This page allows you to track the interactions with all Tooltips over time, as well as dive deeper to see more granular data for individual Tooltips.
Metrics
Views over time

In the chart above you can see the total views for all of your Tooltips as well as the number of unique viewers plotted over time.
Individual Performance
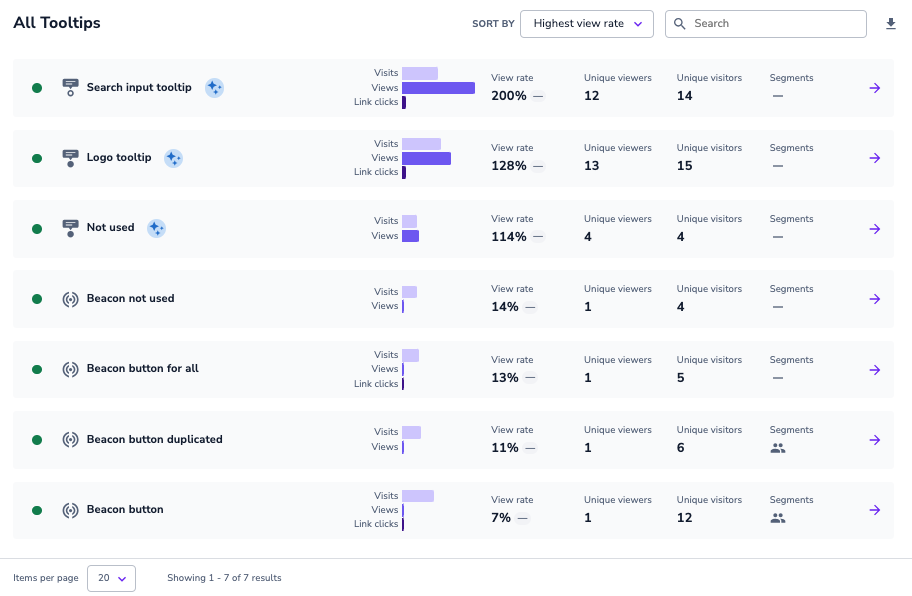
Below the Views over time chart, you will find a table with all Tooltips.

Each row corresponds to an individual Tooltip and offers you a helpful overview of that Tooltip's performance.
The horizontal bar chart in the middle of the table represents total values:
- Visits: a visit is counted when a user comes to a page and the Tooltip loads
- Views: a view is counted when a user has clicked on a Beacon or hovered over a Hint
- Link clicks: if a Guide has been linked to Tooltip, a link click is counted when a user clicks on the linked Guide.
The View Rate metric corresponds to the total visits and views shown in the bar chart and is calculated as (Views / Visits) * 100.
ℹ️ It's possible to have a View Rate greater than 100% for Hints. This is expected because we calculate the View Rate using Total Views and a user can view a Hint type Tooltip multiple times in a single visit.
The table also shows you Unique Viewers and Unique Visitors, which correspond to unique users who have respectively viewed the Tooltip and/or visited the page where the Tooltip is available.
💡 You can filter the table using the metrics described above. For example, filter by Most Unique Viewers to see which Tooltips are reaching the most individual users.
Tooltip Details
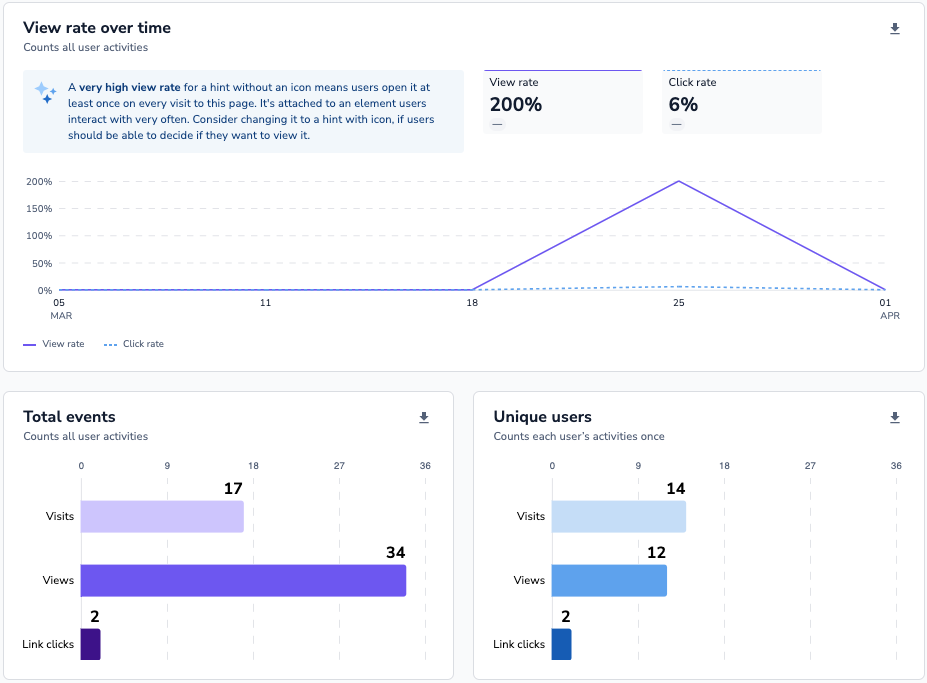
You can click on any individual Tooltip to see how it has performed over time. In this case, you will see a representation of View Rate and Click Rate, with Click Rate being calculated as (Total Clicks / Total Views) * 100.
Below you will find a graphical representation of Total Events and Unique Users, similar to the All Tooltips table on the overview page.

