Why use it
Measuring the Net Promoter Score (NPS) is the key to understanding your users’ opinion about your application. Sending the NPS survey via email requires a lot of manual setup and the response rate tends to be lower. It is time to move your NPS to where your users are - into your application.
About NPS
NPS is a recognized method to track your user’s loyalty and opinion based on how likely they are to recommend your app.
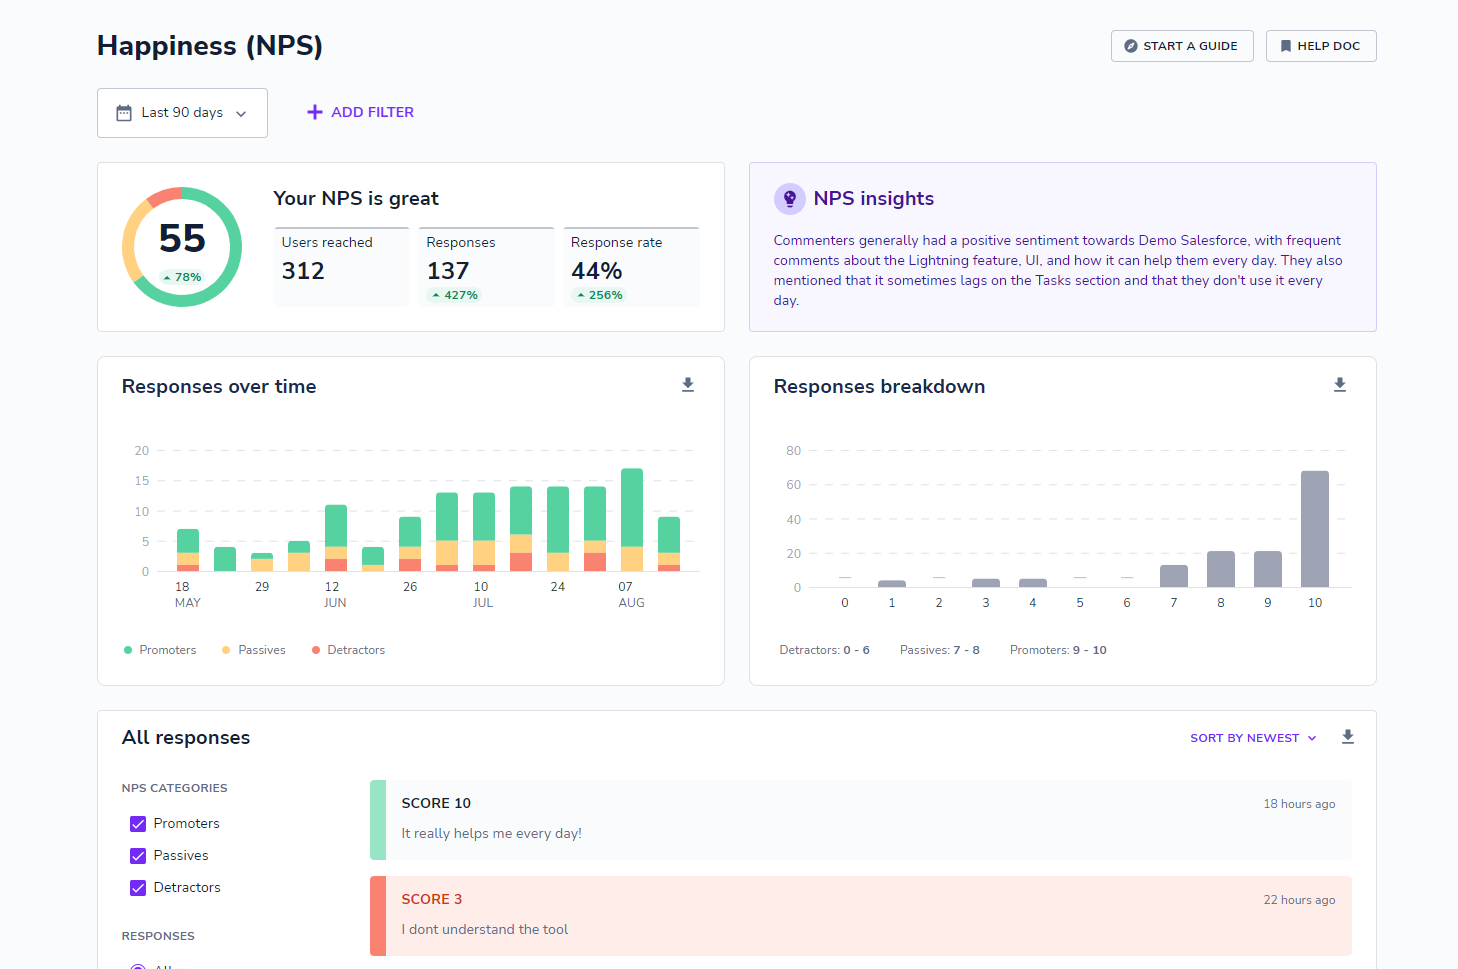
User responses range from 0-10 and they are divided in 3 groups:
Detractors: responses of 0-6. These users are not satisfied and could potentially share their negative experiences with the others around them.
Passives: responses of 7-8. These users have a neutral attitude towards your product. Passives are not unhappy, but also not likely to recommend your app.
Promoters: responses of 9-10. These users enjoy using your app and are likely to recommend it to others. In the B2C case, these users are likely to purchase from you again.
ℹ️ NPS score is calculated by subtracting the percentage of your detractors from your promoters -> NPS = % of Promoters – % of Detractors.
NPS analytics
You will be able to see your NPS on your Analytics page. It also displays various trends, such as the score going up or down over time. You will also see comments that users left that can suggest improvements. For deeper analysis, you can apply existing user segments to all responses.
How is it calculated?
| NPS score | (promoters - detractors) / all responses NPS score can be from -100 to 100. |
| Promoters | response scores 9 and 10 |
| Passives | response scores 7 and 8 |
| Detractors | response scores 6 or lower |
