Why use it
Use Guide Analytics to monitor how well each of your Guides is driving software adoption, based on how far users have progressed through it.
It helps you to:
- evaluate the performance of each individual step
- identify crucial drop-off points
- make continuous improvements.
Metrics
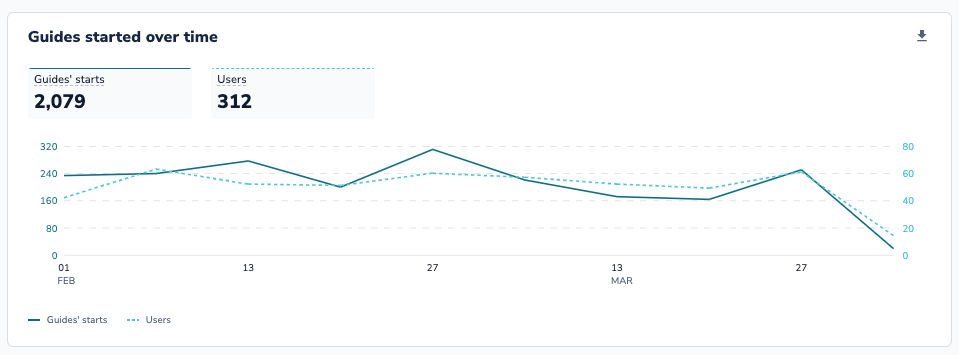
Guides started over time
Guides' Starting Points
Where the user found and started the Guide.
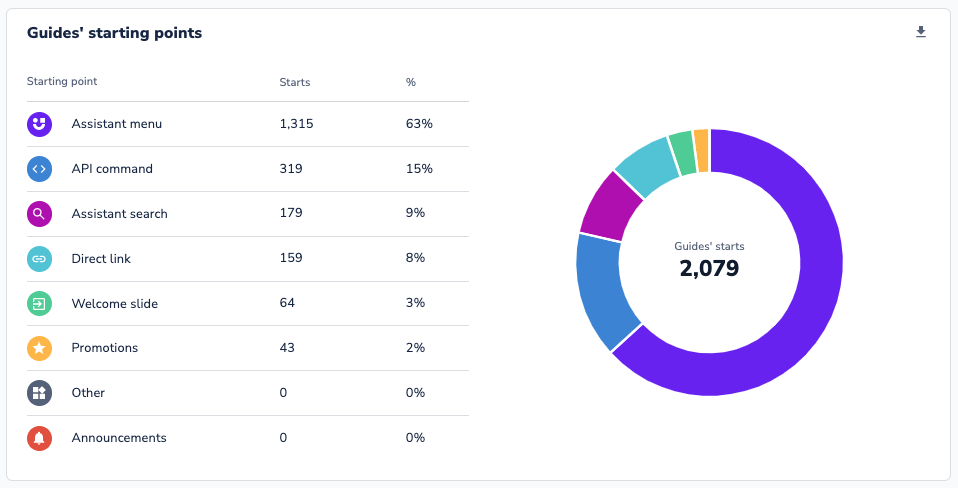
Total: The number of times a Guide was started from each source.
%: The percentage of times a Guide was started from each source out of the total Guide starts.
Individual Performance
Here, you will be able to find performance metrics for each individual Guide that you have published.
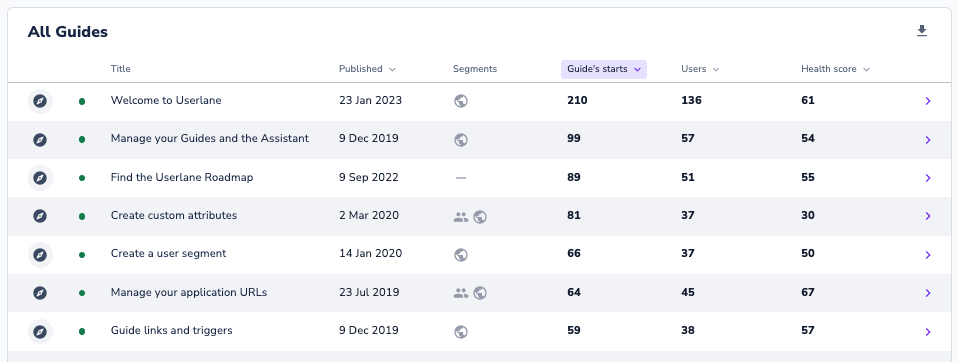
Next to each of your Guides, you will see the Guides' current status:
- green dot: Guide is currently live
- grey dot: Guide was live but is now unpublished
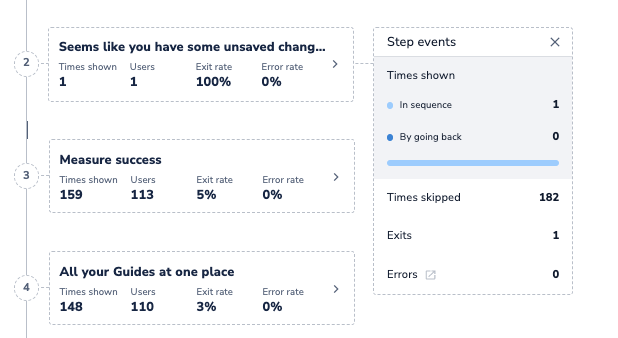
Step Details
You can click on any individual Guide to analyze its performance further and understand exit points and errors.
Step Type

- First/Last Slide: appear as squares in the step list.
- Mandatory Step: appear as a solid circle in the step list. These steps require user interaction before they can proceed to the next step.
- Optional Step: appear as a dotted circle in the step list. These steps either don't require user interaction before users can proceed (e.g. explanation step) or they might have some skip logic linked.
- Step Alert: appear as a red circle in the step list. Users have experienced errors in these steps. Review these errors by opening the error log contained within the step details.
Step Events
For every step you can review the events to better understand whether errors occurred.
For more information around errors, review the following article: Alert notifications
Best Practices
Utilize the Health Score
Each Guide has a calculated Health Score. The Health Score indicates how far your users progressed through a Guide.
💡 Health Score = [Number of times a Guide was completed / (Number of times a Guide was started - Number of times a Guide was exited on the first step)]
The score ranges from 0 to 100 where a 100 means all users are completing the Guide.
Understand the reason for the low Health Score
- Error Alert was triggered: Users have challenges completing this Guide.
- Action: Take a look at this article on resolving alerts.
- No Error Alert but low Health Score compared to others: Users have challenges completing this Guide. If the Guide is not breaking, then the users are exiting intentionally.
- Action: Review the Guide to consider why a user might exit.
- Example: If you included a link within one of the steps in the Guide, it is possible that the users are clicking on the link but then never returning to complete the Guide. Consider only including links in steps that are towards the end of the Guide so that users are not being encouraged to leave the Guide before completing important steps.
- Leaving Guide earlier than expected: Users may find the answer to a question they had before reaching the end of the Guide and will exit early.
- Action: Review whether links are embedded in the beginning of the Guide or process can be finished without completing the Guide. Consider adjusting the Guide or segment.
